

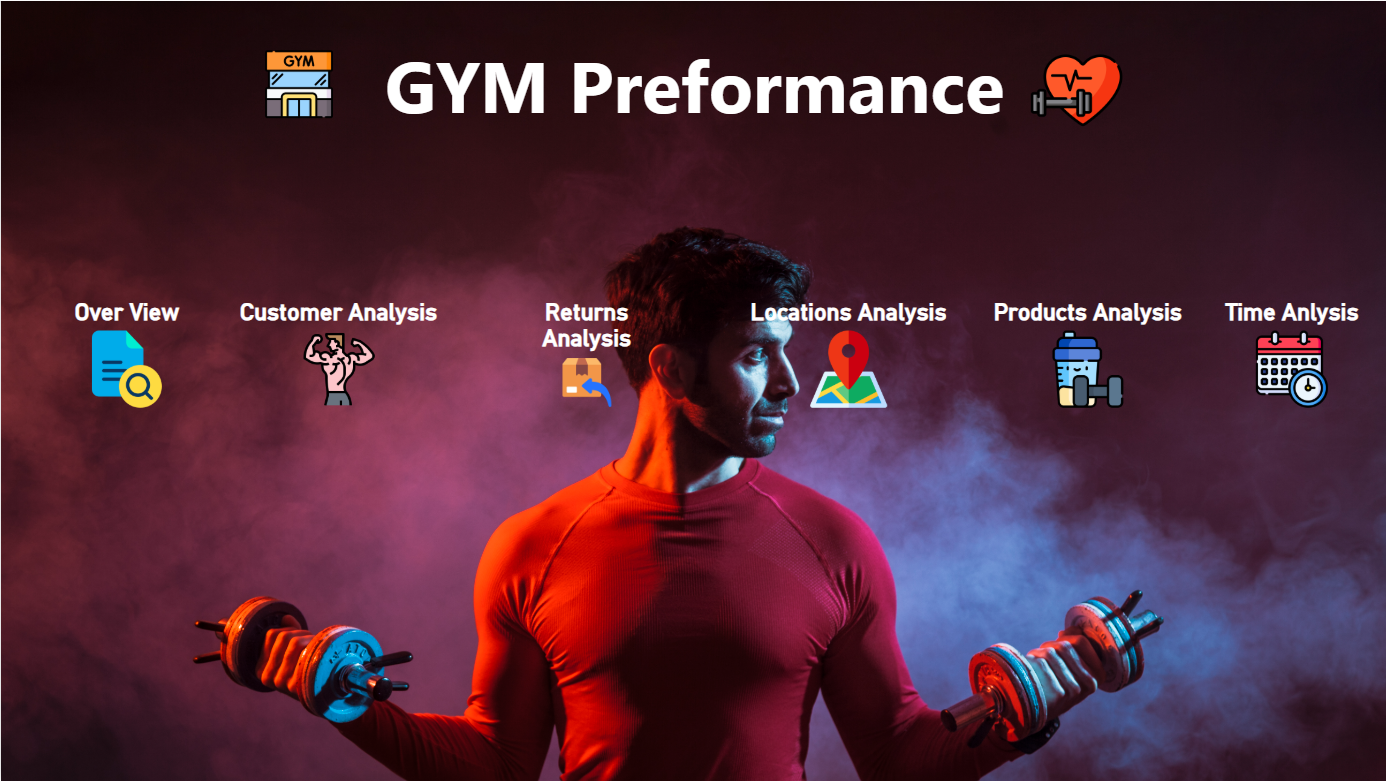
GYM Preformance
(Click here to show more)
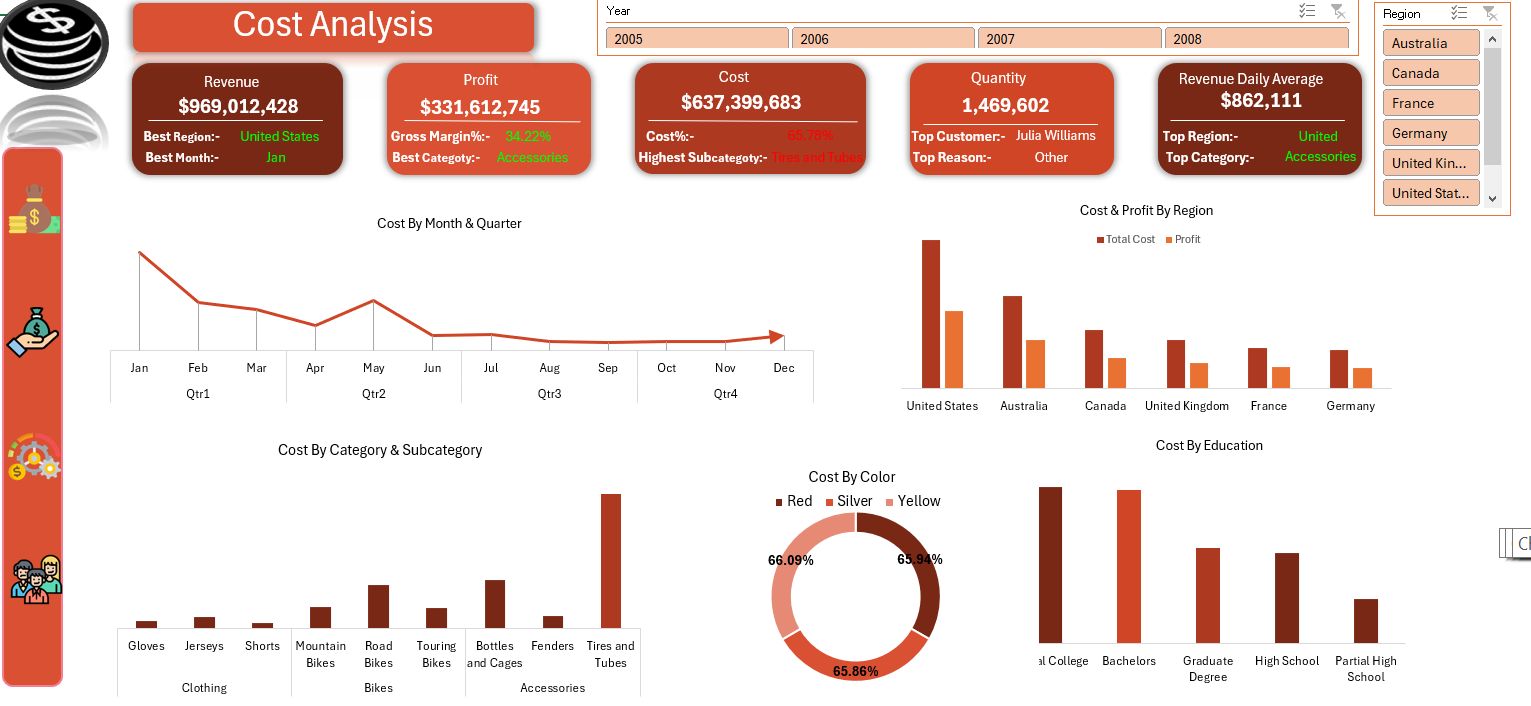
This project aimed to provide a clear view of sales performance and uncover key insights to support strategic decision-making.
Key Achievements:
- Data Extraction: Pulled data directly from SQL Server with custom queries, ensuring accuracy and real-time data.
- Data Cleaning: Used Power Query for data cleaning and transformations, merging tables for consistency and accuracy.
- Data Modeling: Implemented a star schema to optimize performance and streamline analysis between sales, customers, and products.
- Custom DAX Calculations: Developed DAX measures to calculate crucial KPIs like revenue, profit, customer count, and order quantities for deeper business insights.
Analysis Highlights:
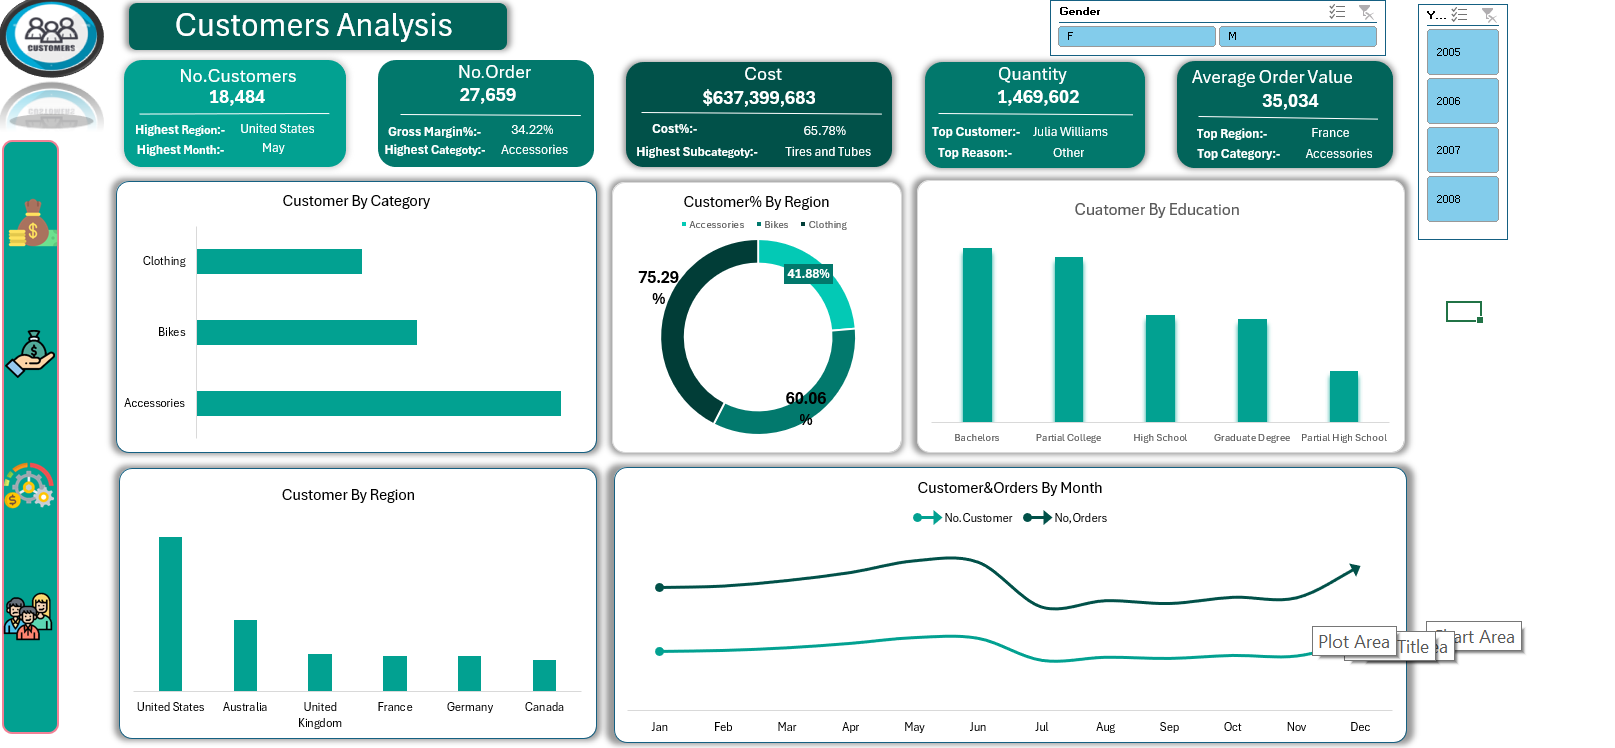
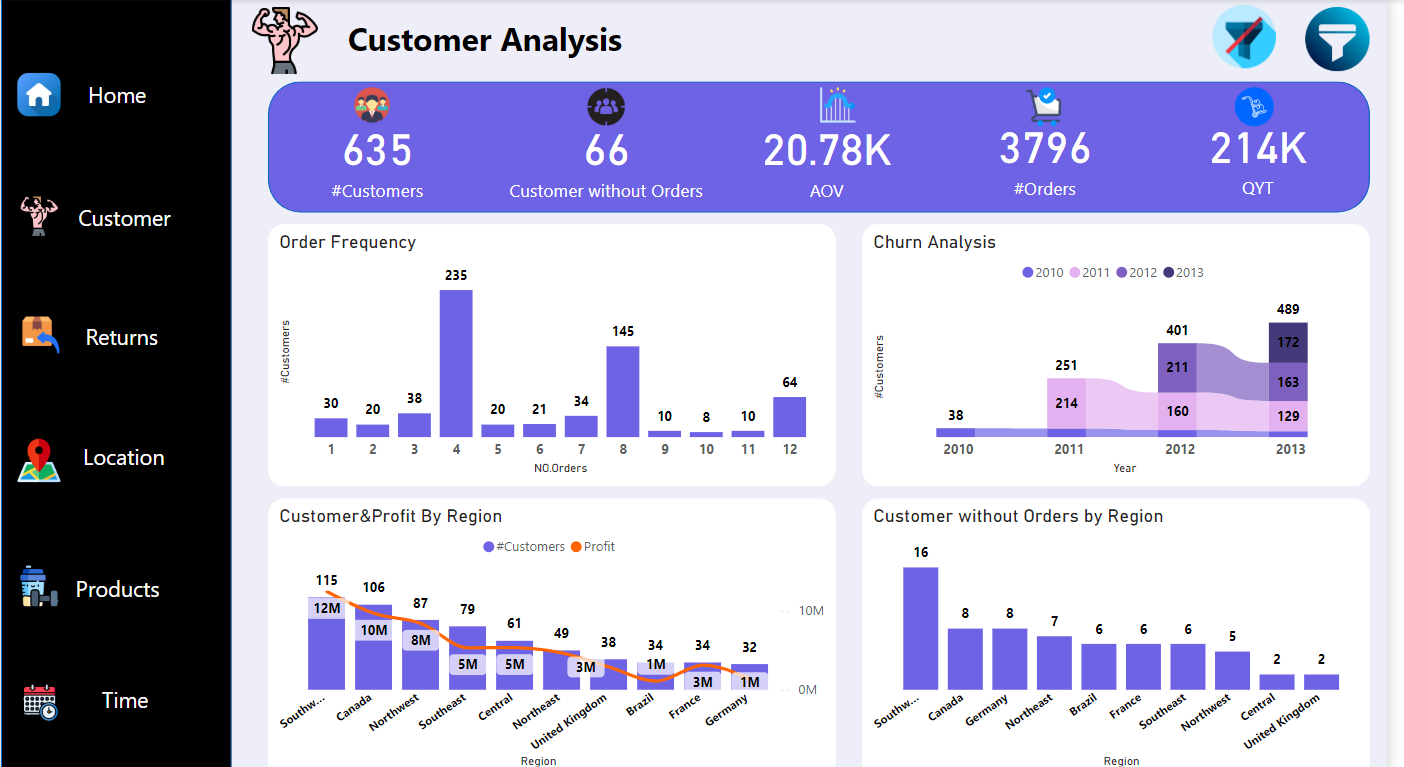
1. Customer Segmentation: Analyze purchase behavior and churn rates to understand customer trends.
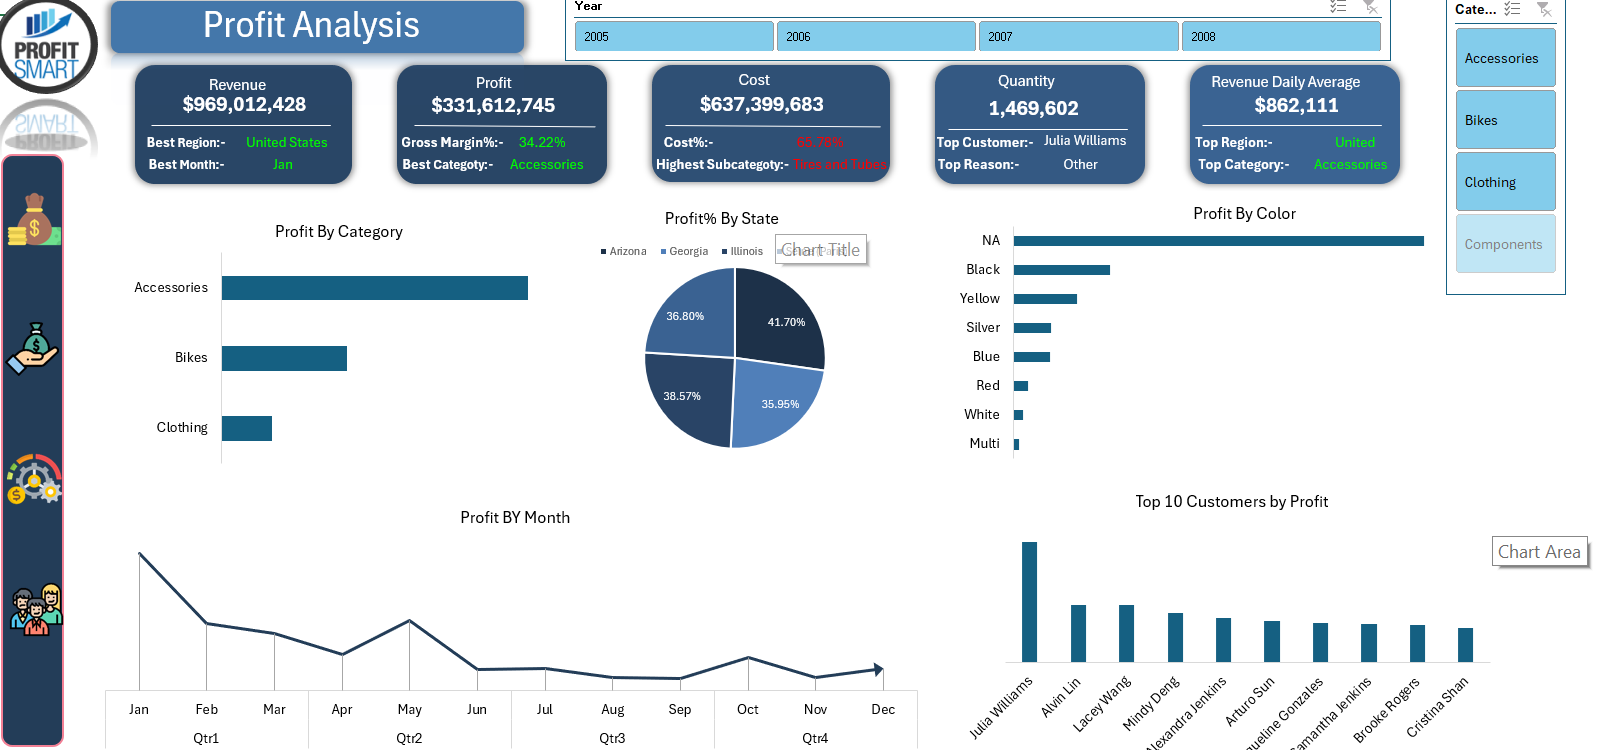
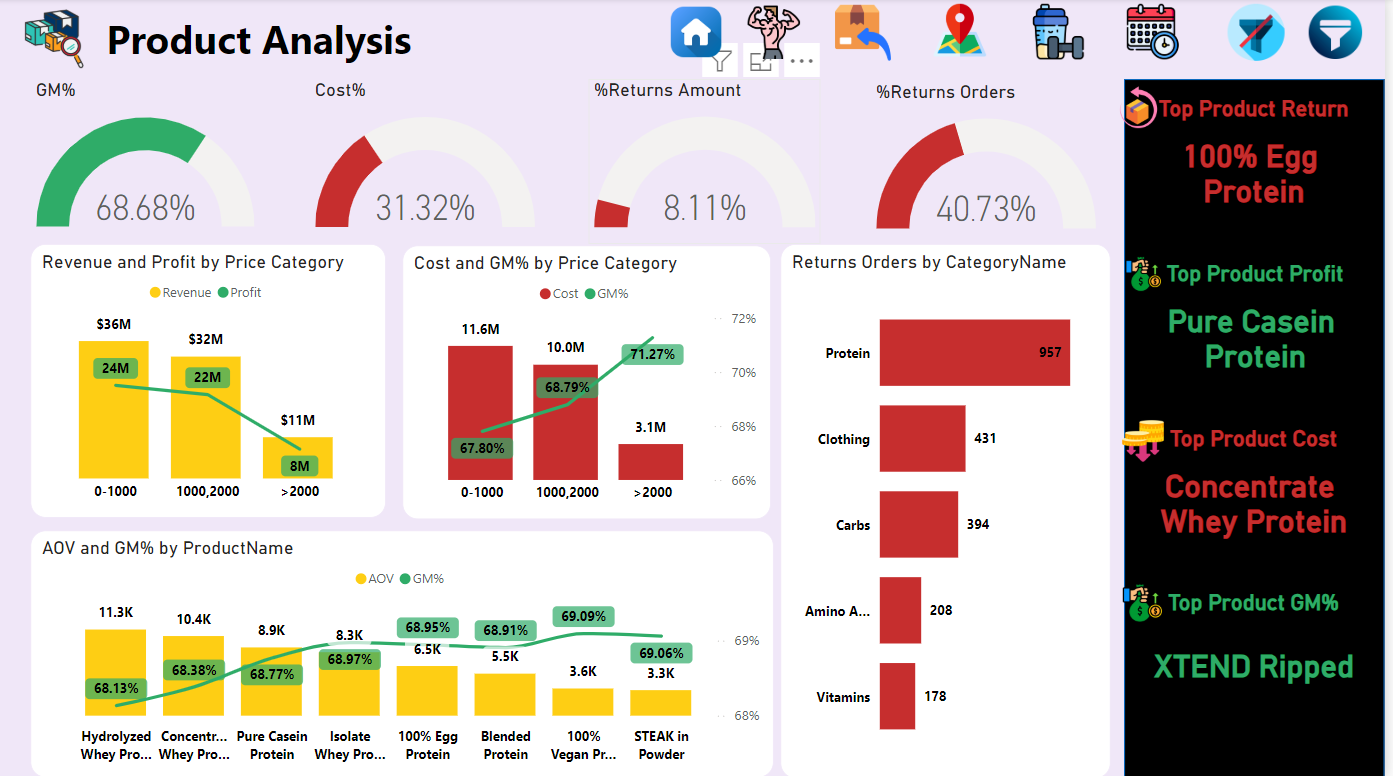
2. Product Performance: Identified top-performing products and areas needing improvement.
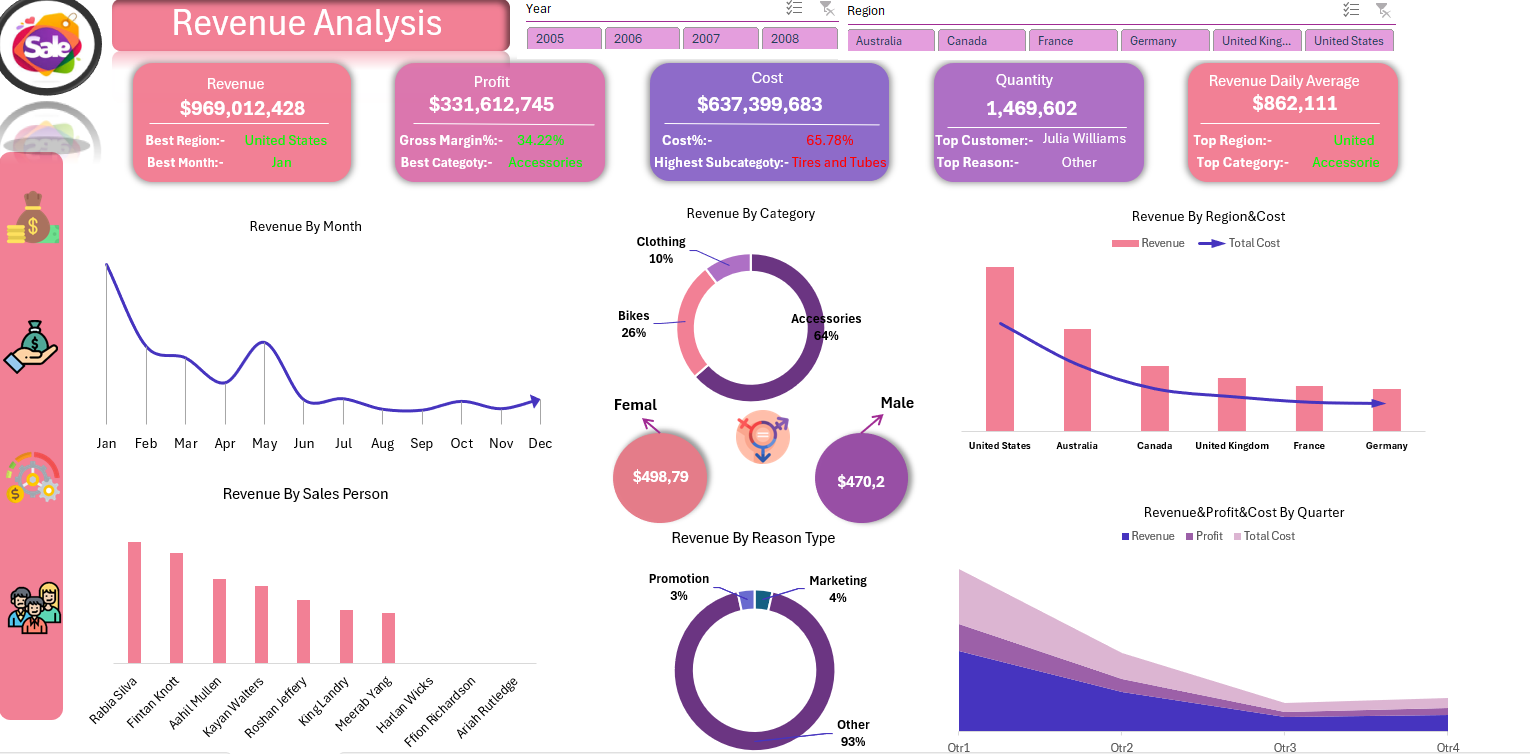
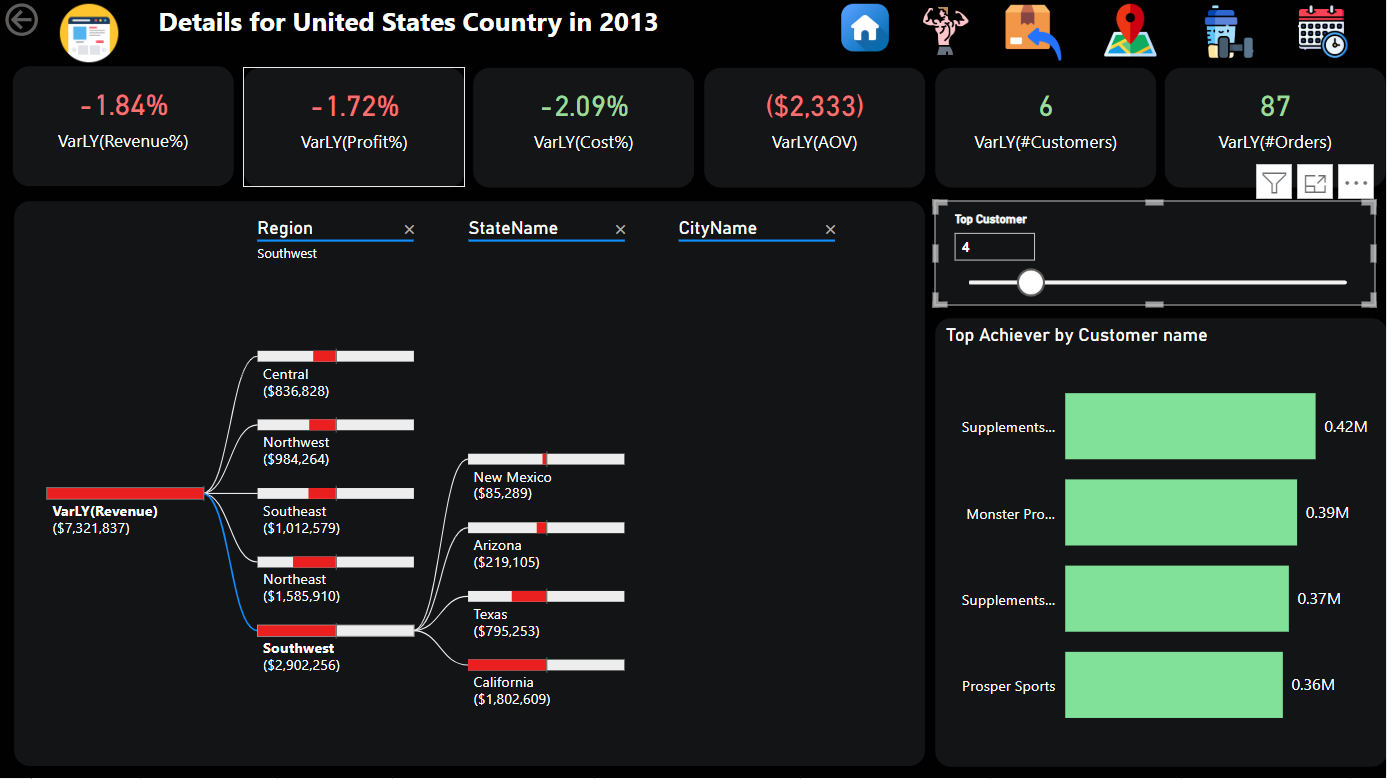
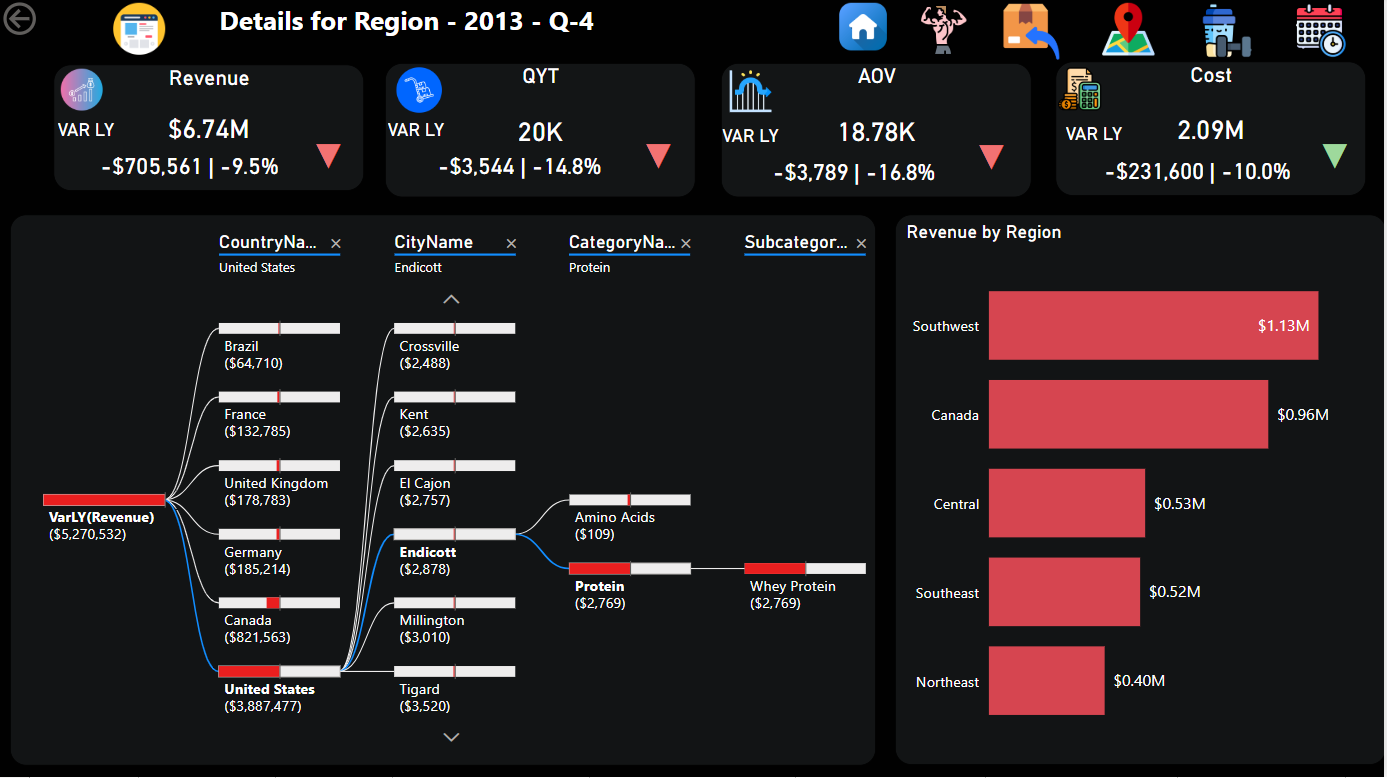
3. Location Insights: Explored sales patterns by region to find best-performing areas.
4. Time Analysis: Tracked seasonal trends and forecasted future sales performance.
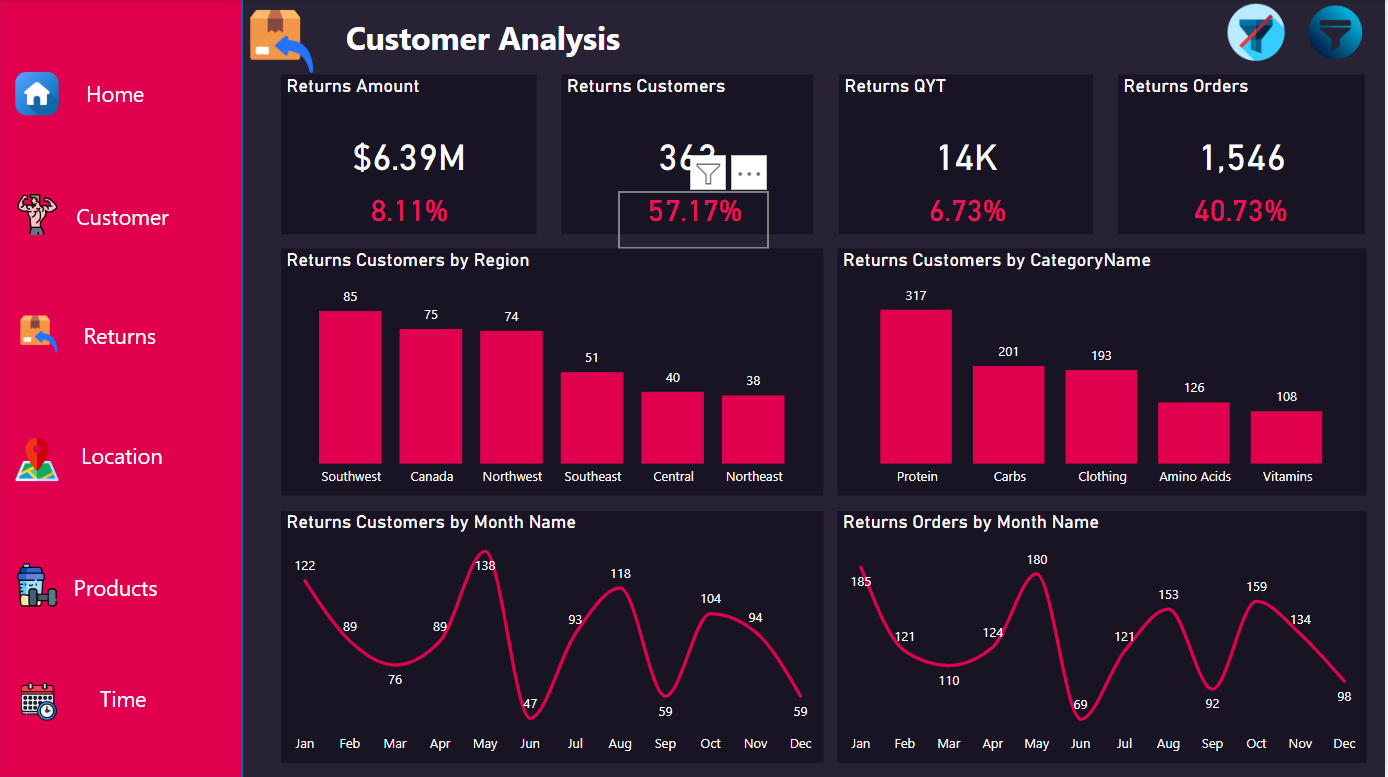
5. Return Analysis: Investigated product returns to refine strategies and reduce losses.
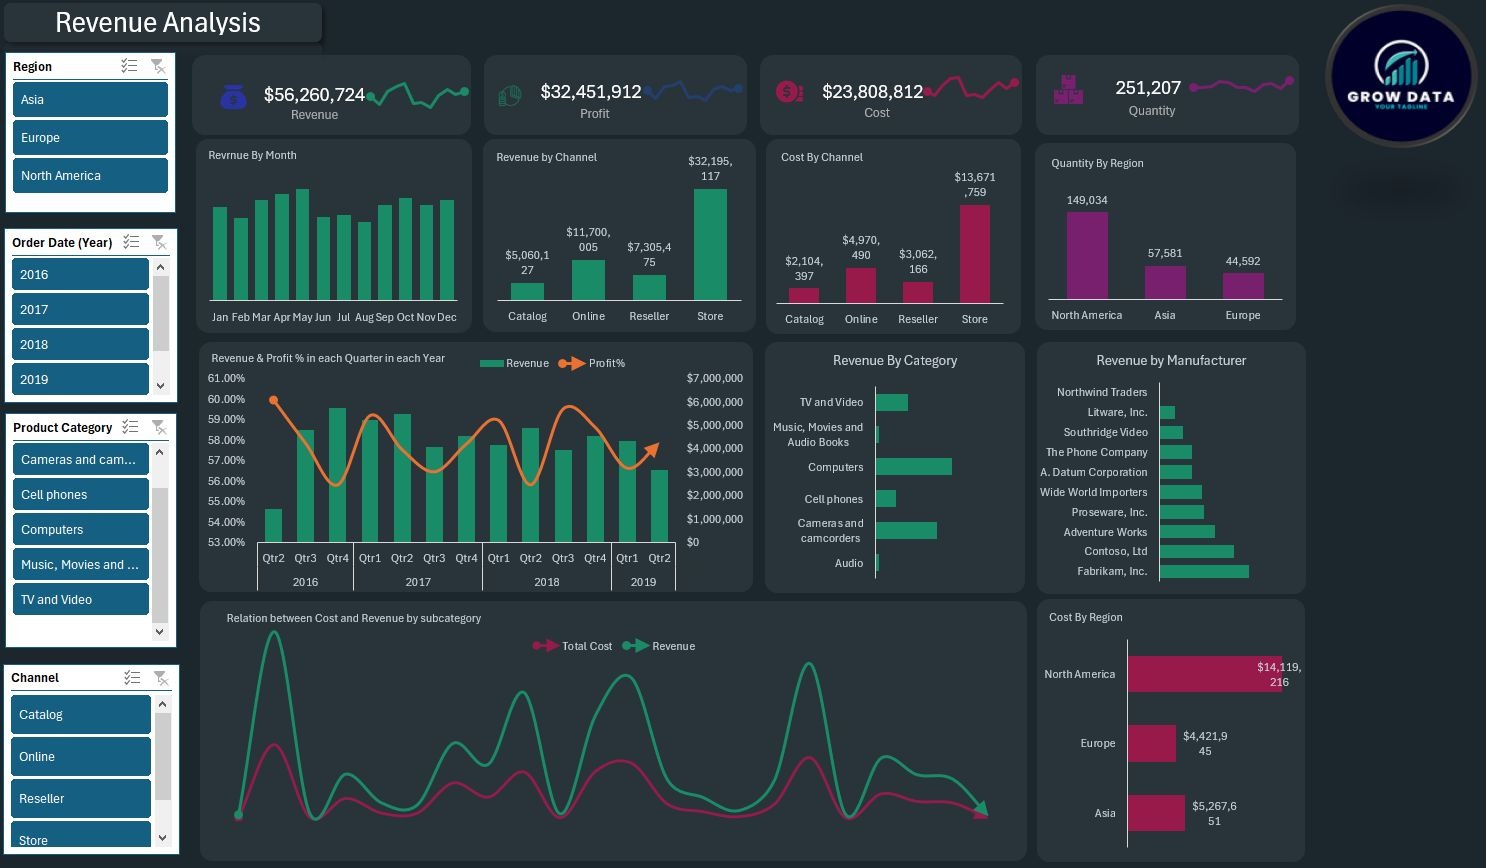
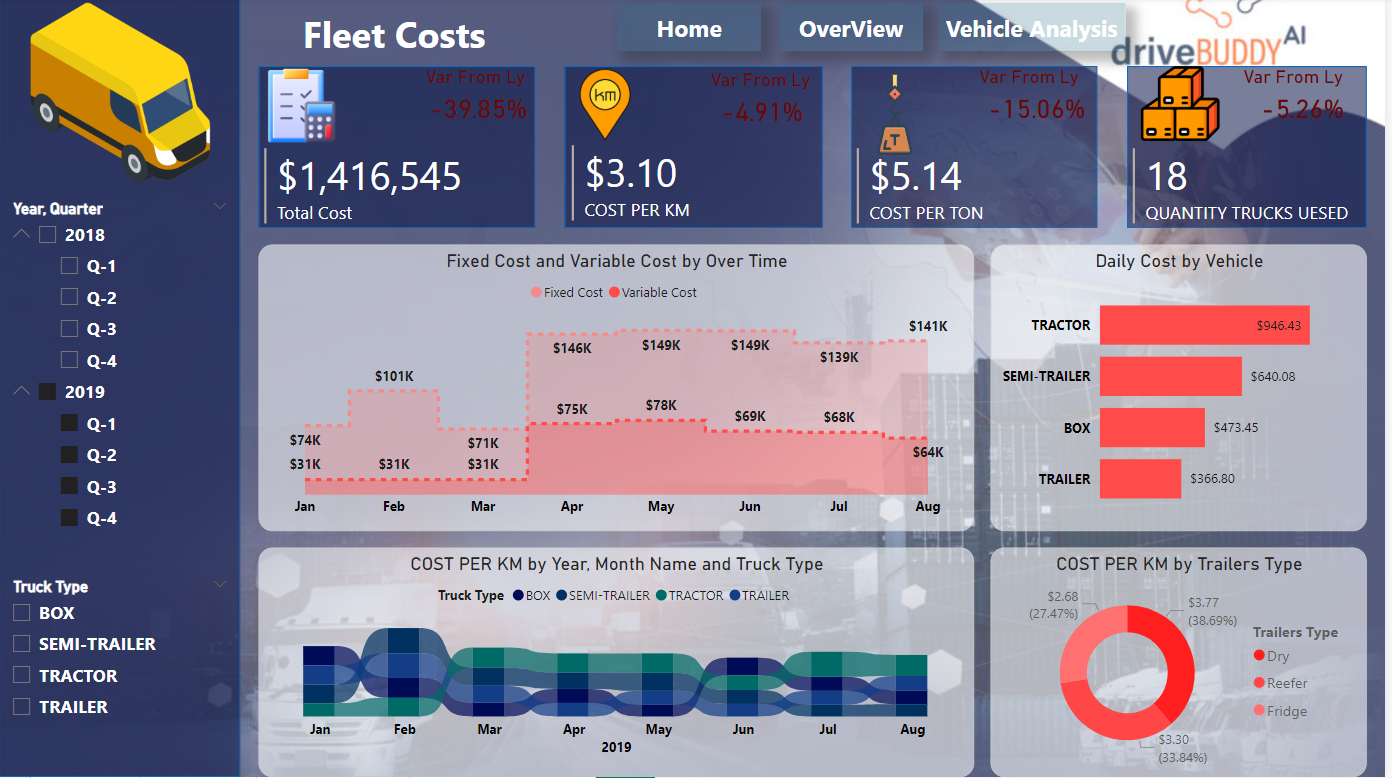
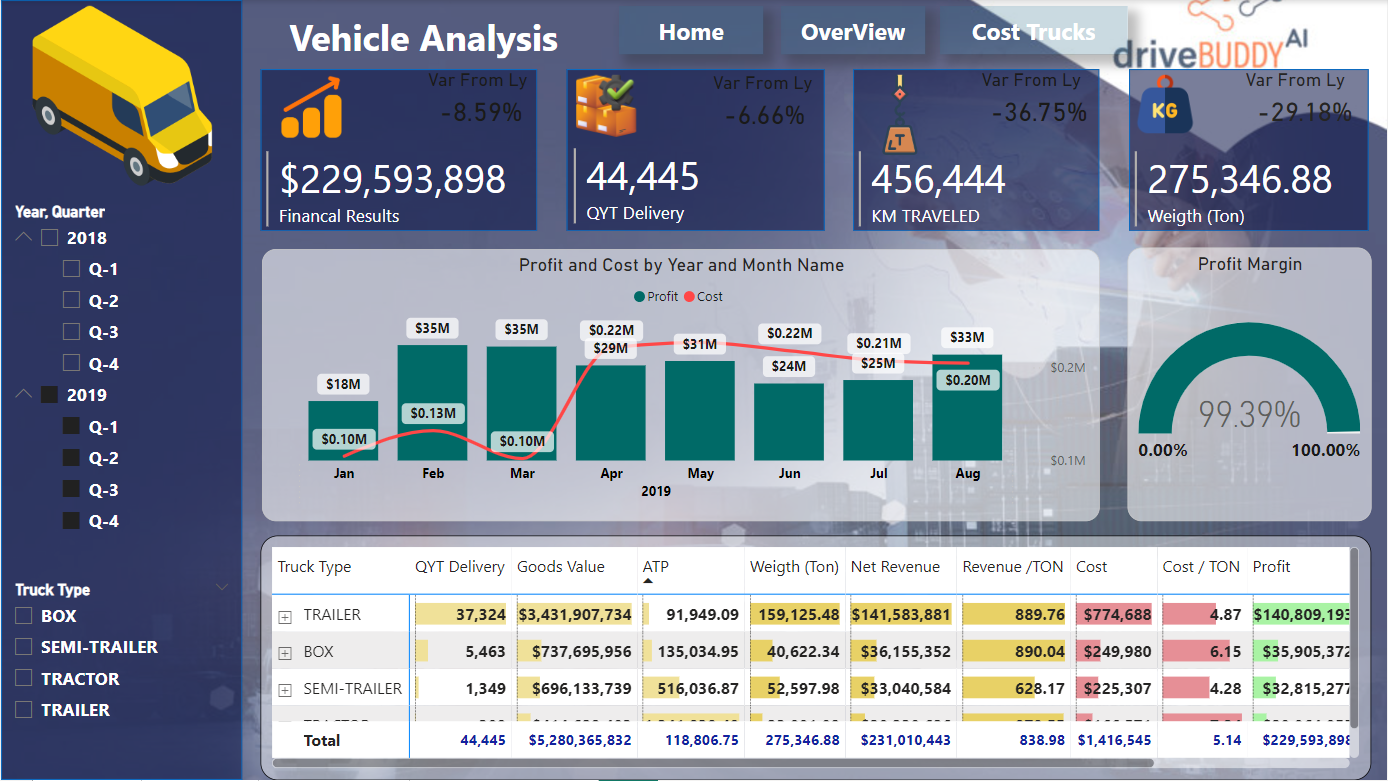
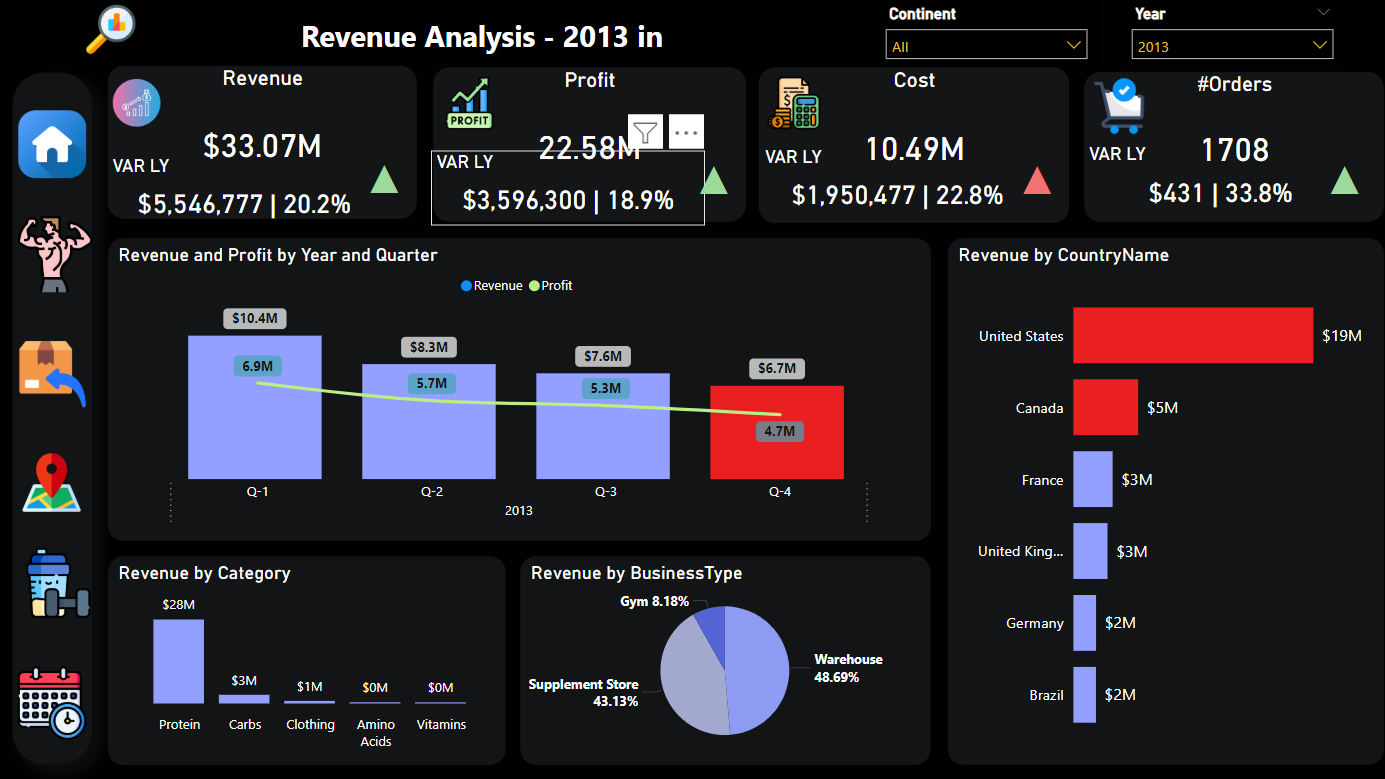
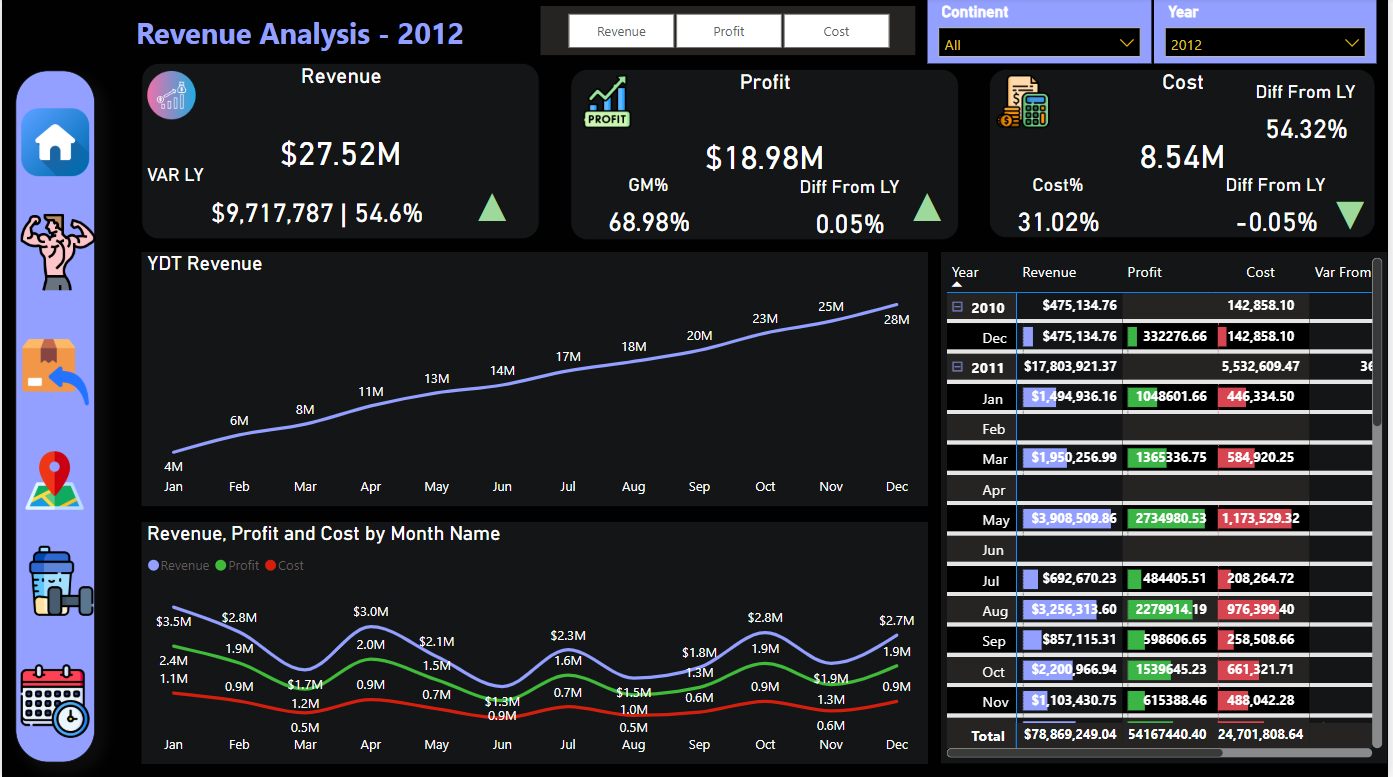
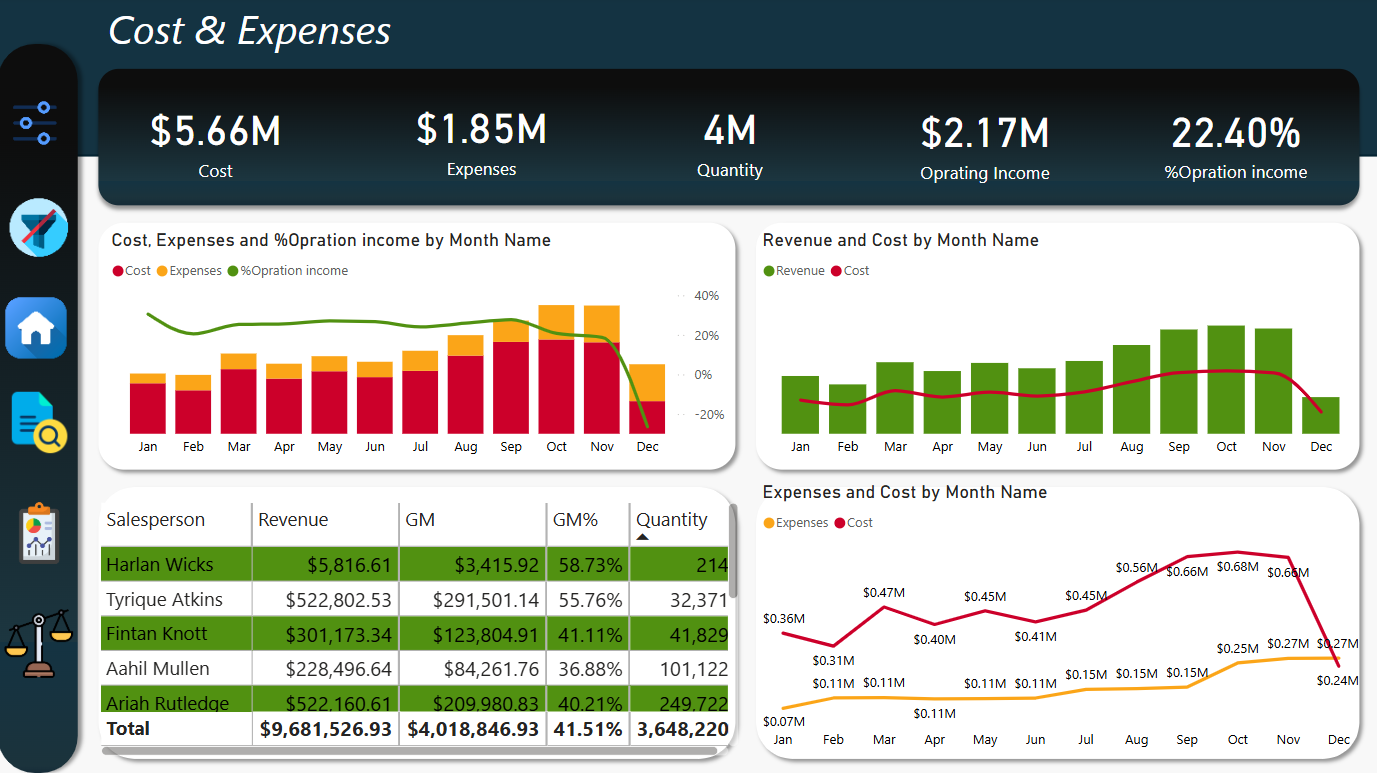
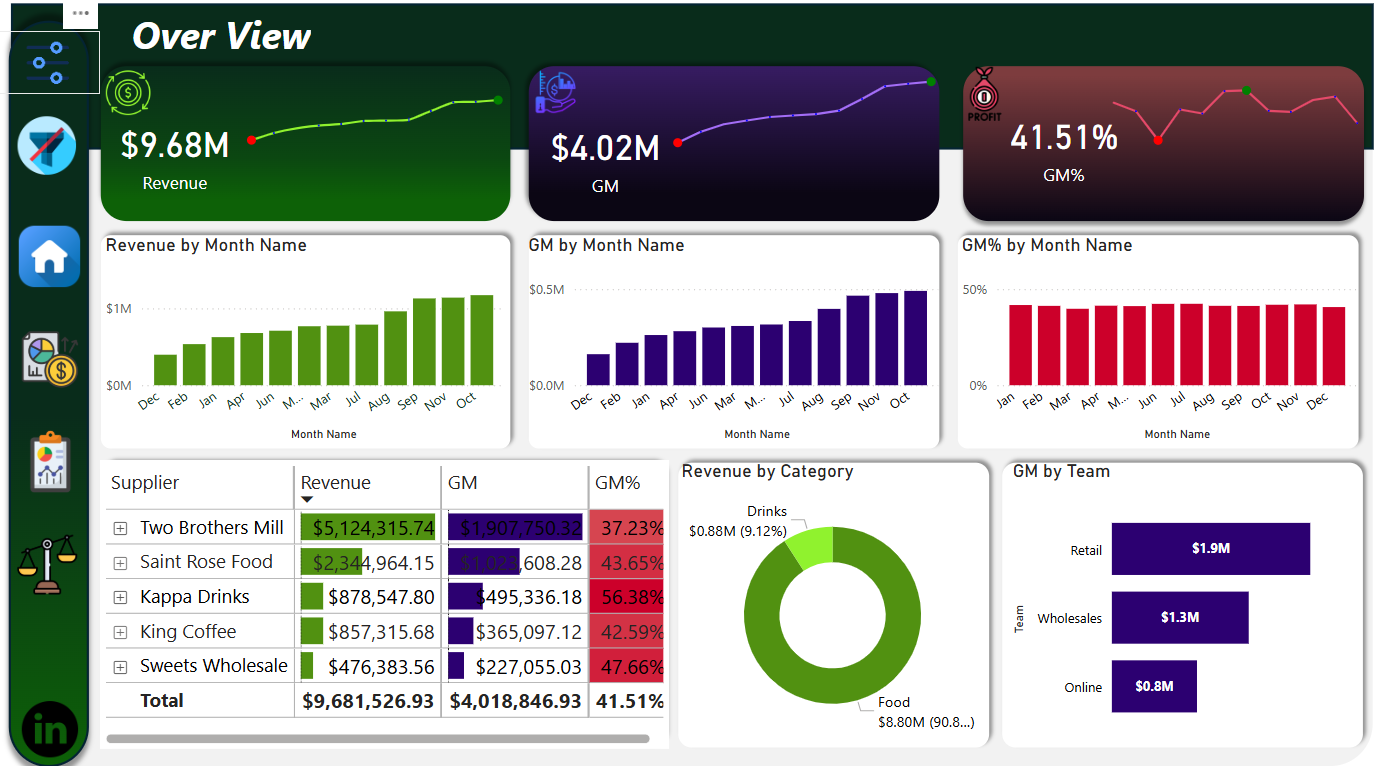
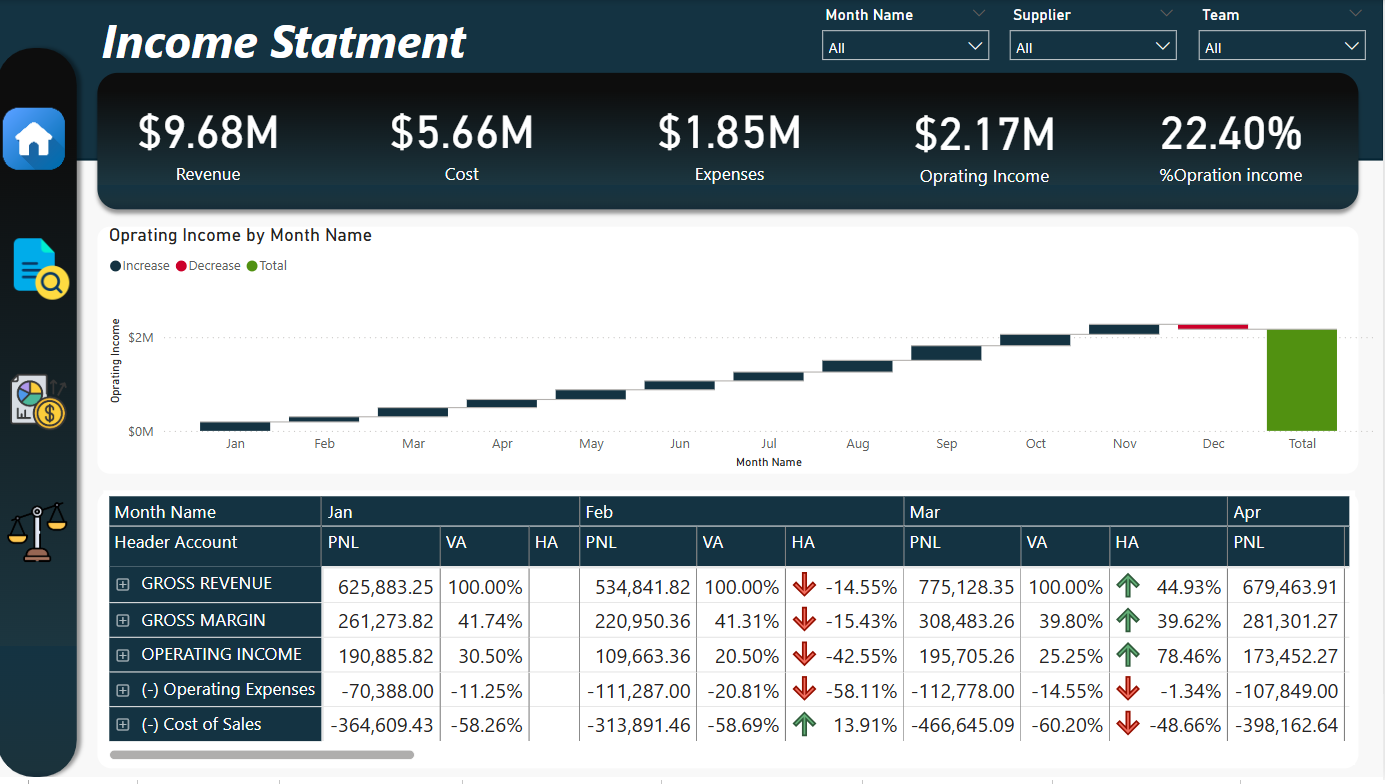
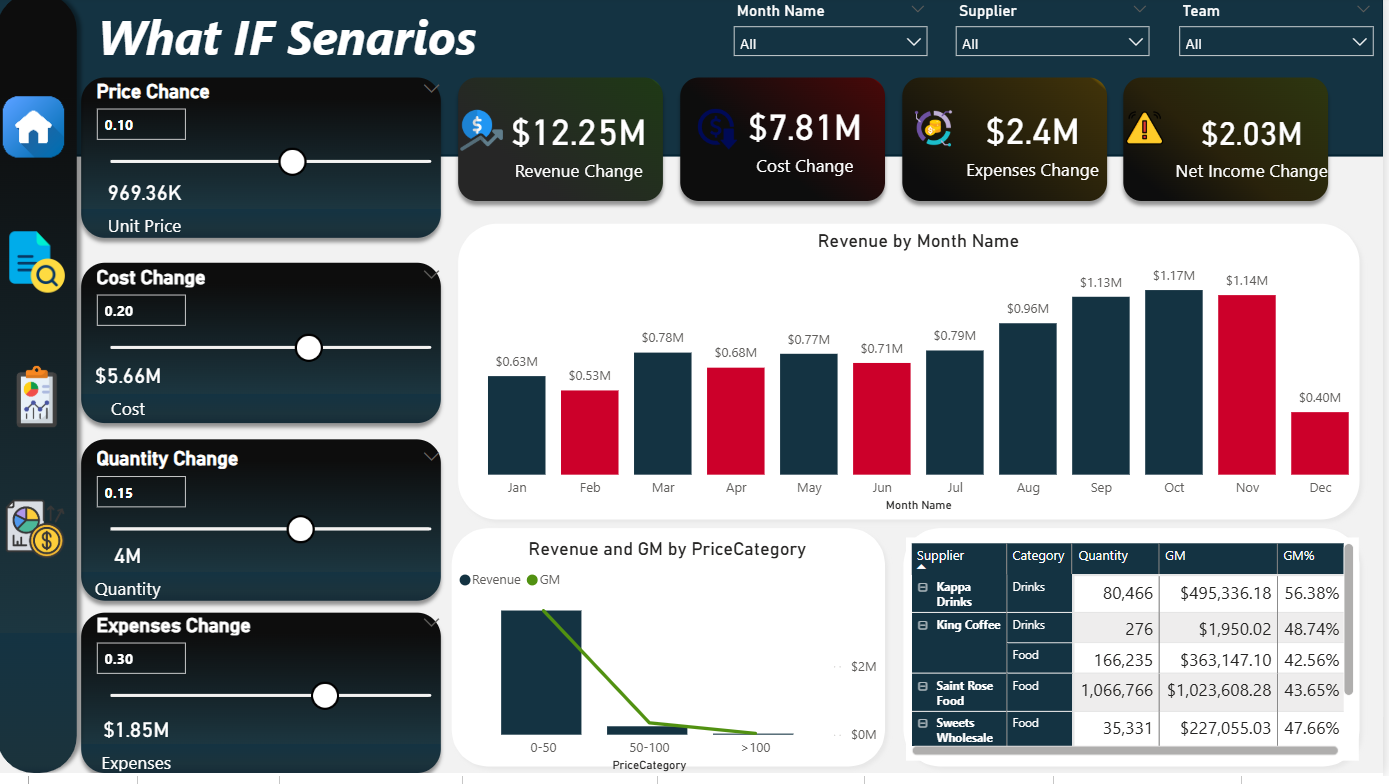
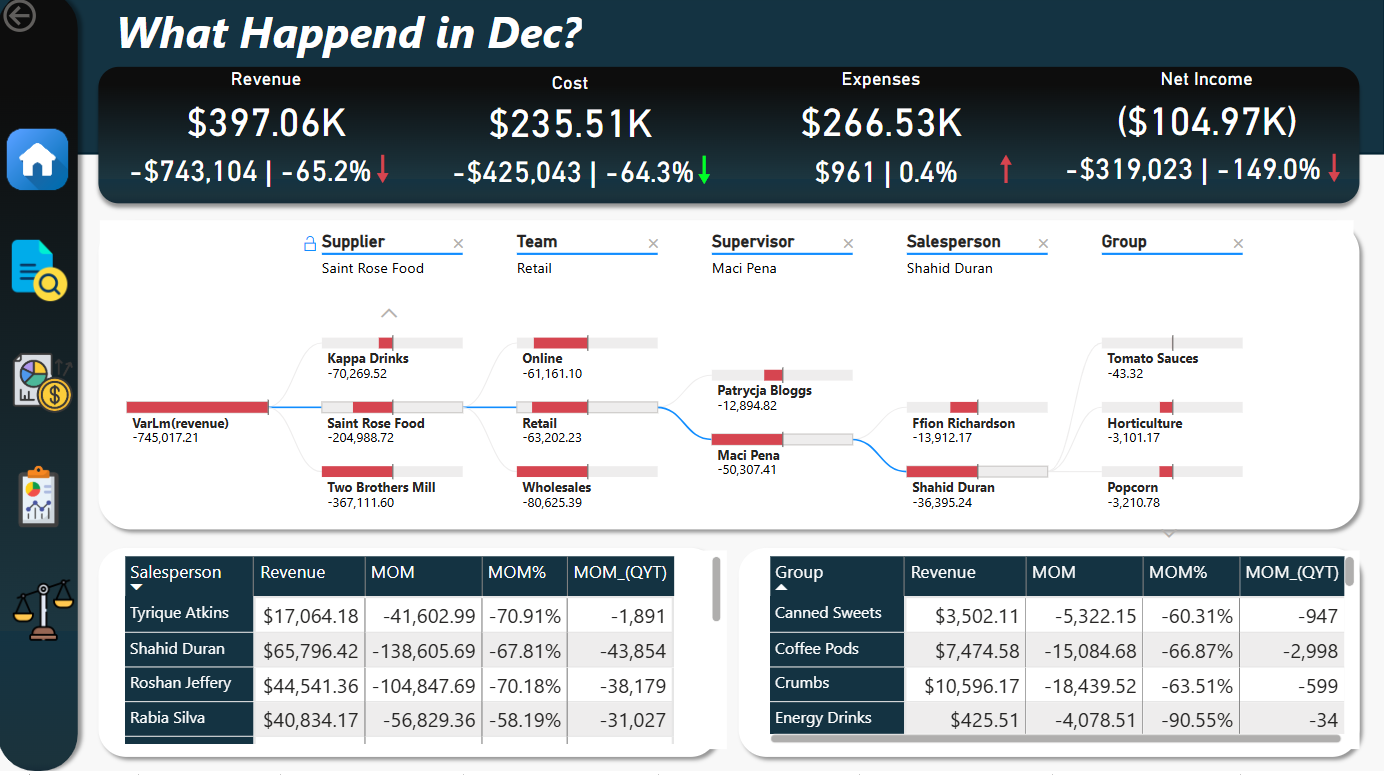
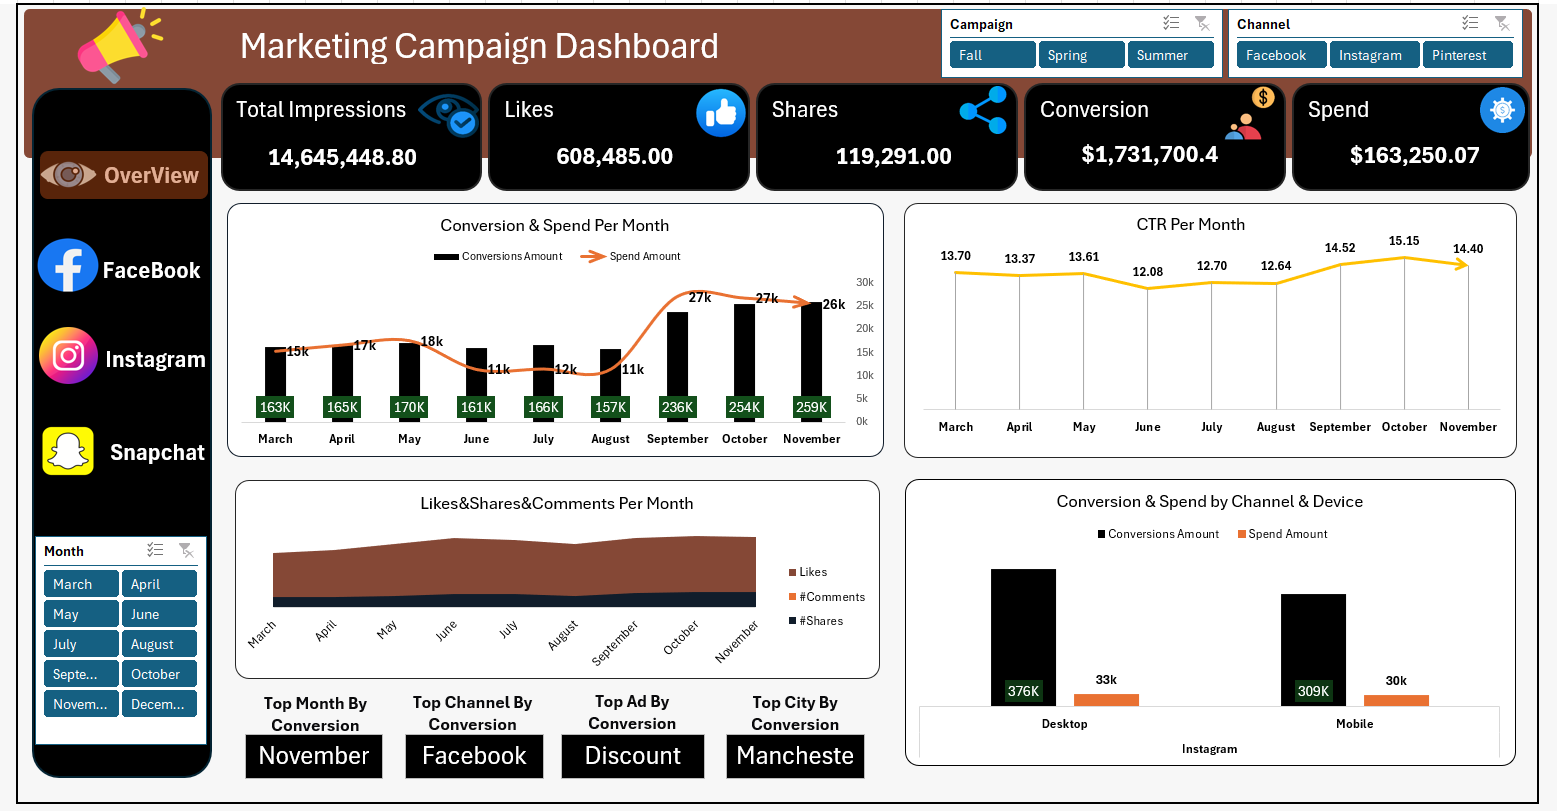
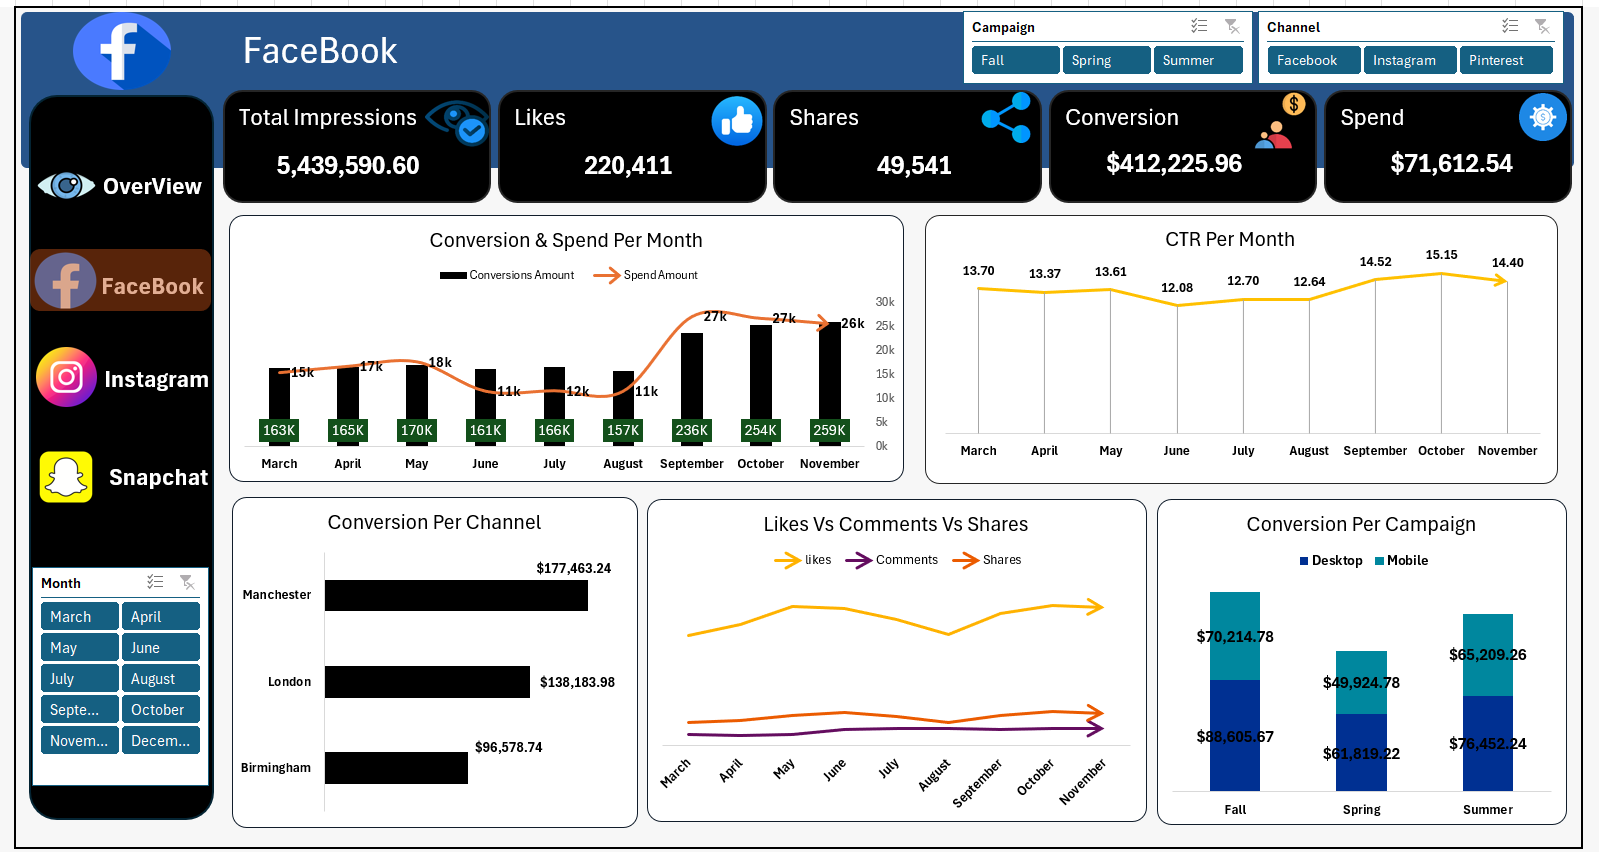
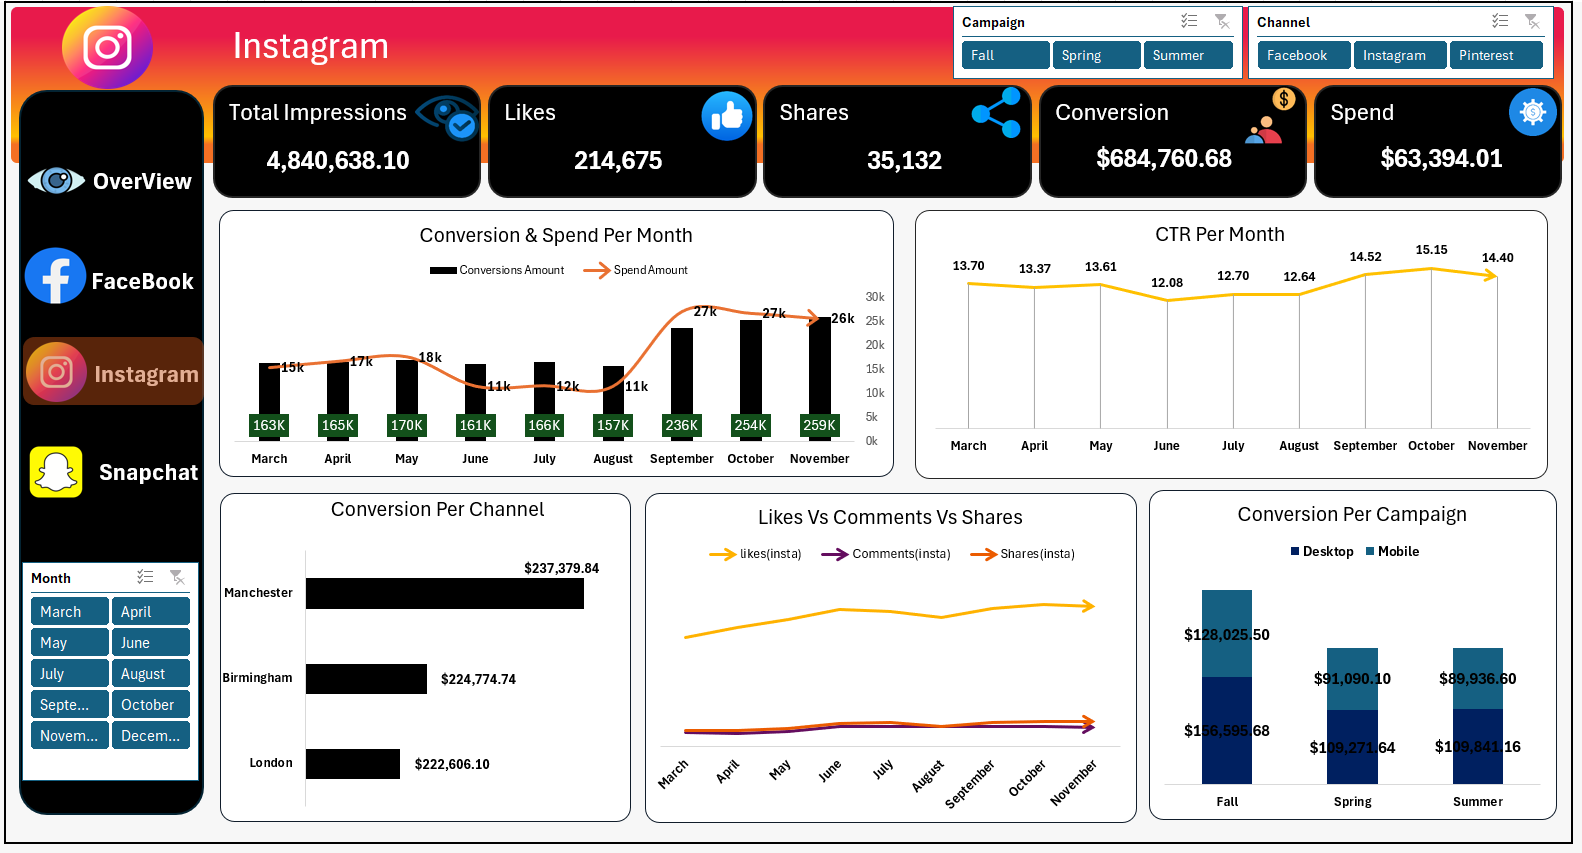
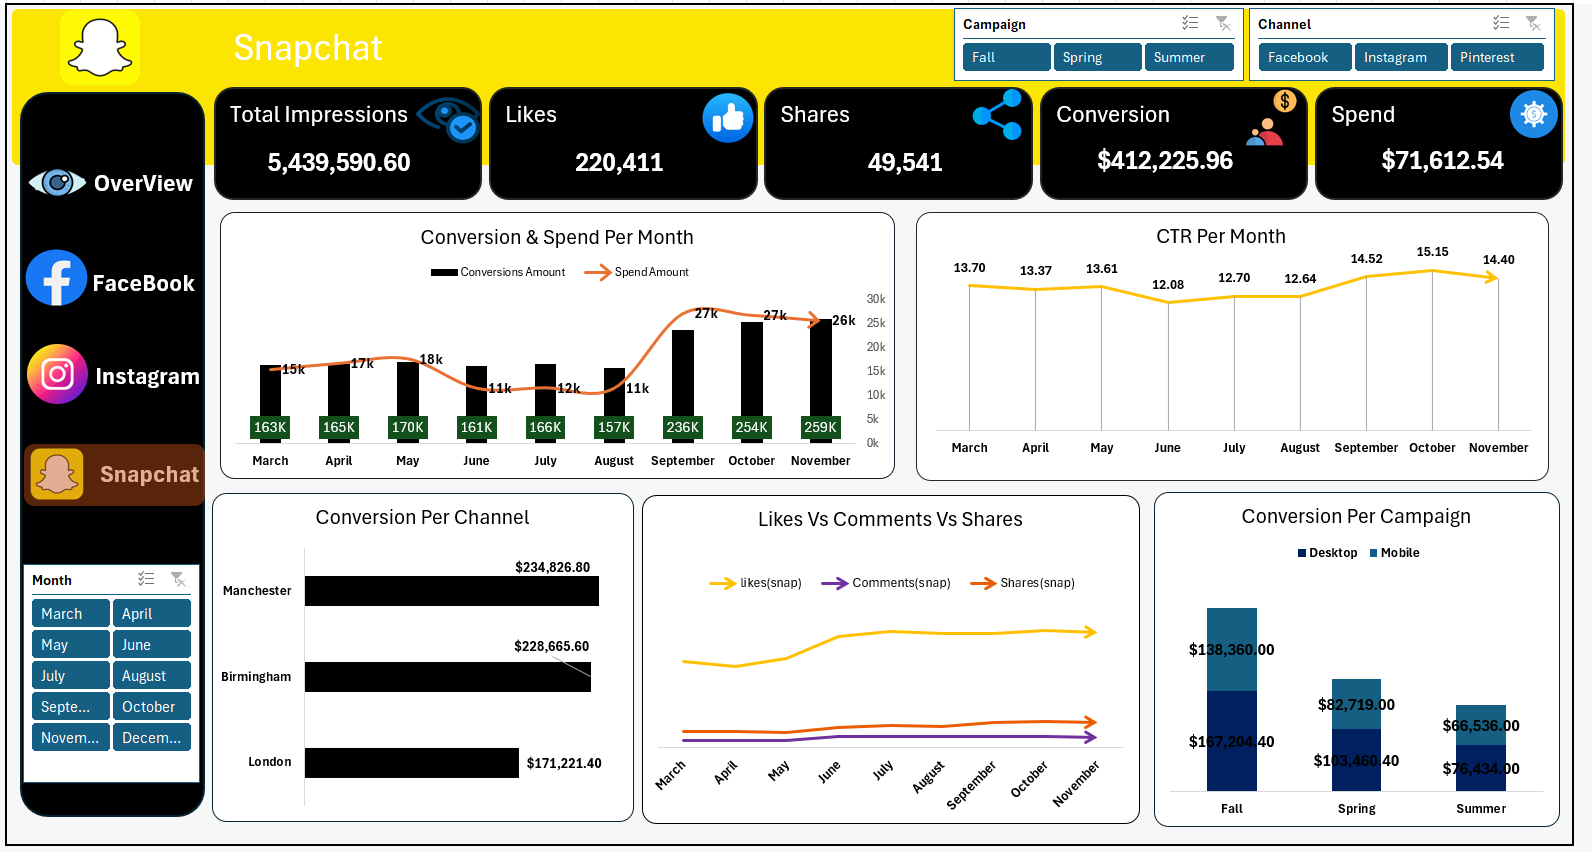
Dashboard:
Created an interactive dashboard displaying key KPIs and sales trends, with dynamic filters to drill into data by location, time, and product categories.
Final Results:
The analysis provided a comprehensive view of the company’s performance, highlighting profitable products, engaged customers, and top regions, empowering data-driven decision-making.
This project aimed to provide a clear view of sales performance and uncover key insights to support strategic decision-making.
Key Achievements:
- Data Extraction: Pulled data directly from SQL Server with custom queries, ensuring accuracy and real-time data.
- Data Cleaning: Used Power Query for data cleaning and transformations, merging tables for consistency and accuracy.
- Data Modeling: Implemented a star schema to optimize performance and streamline analysis between sales, customers, and products.
- Custom DAX Calculations: Developed DAX measures to calculate crucial KPIs like revenue, profit, customer count, and order quantities for deeper business insights.
Analysis Highlights:
1. Customer Segmentation: Analyze purchase behavior and churn rates to understand customer trends.
2. Product Performance: Identified top-performing products and areas needing improvement.
3. Location Insights: Explored sales patterns by region to find best-performing areas.
4. Time Analysis: Tracked seasonal trends and forecasted future sales performance.
5. Return Analysis: Investigated product returns to refine strategies and reduce losses.
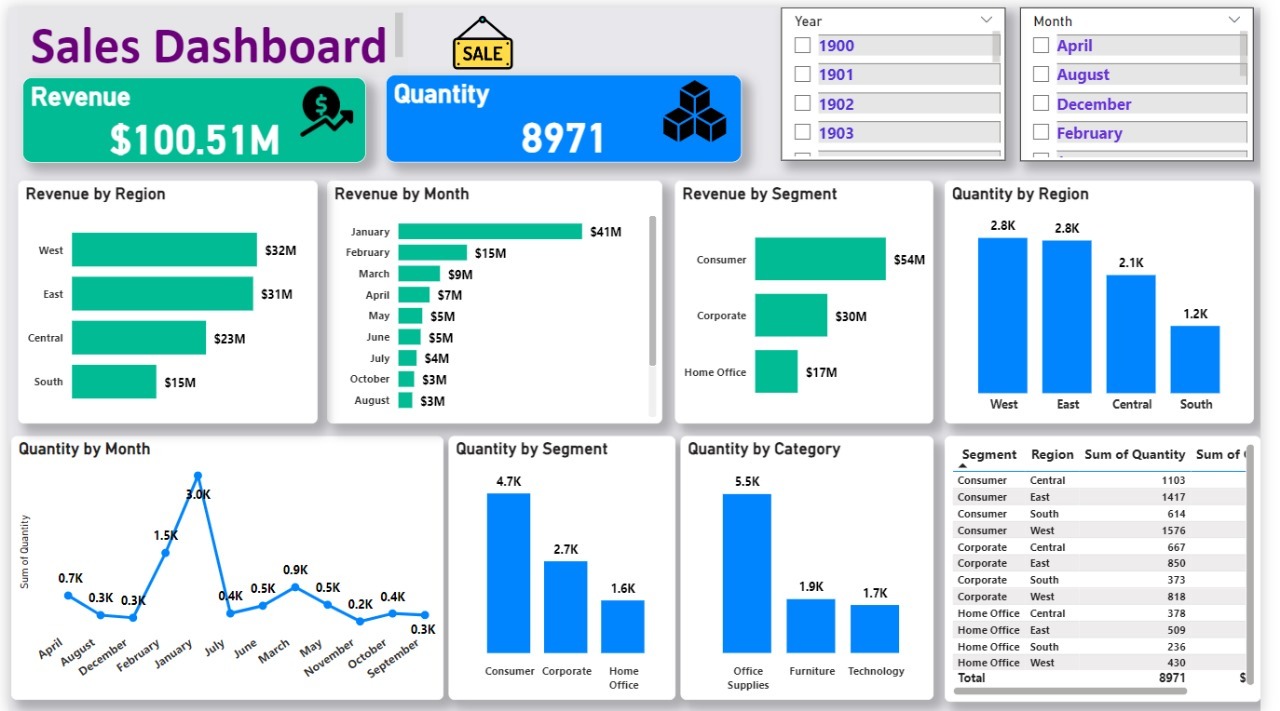
Dashboard:
Created an interactive dashboard displaying key KPIs and sales trends, with dynamic filters to drill into data by location, time, and product categories.
Final Results:
The analysis provided a comprehensive view of the company’s performance, highlighting profitable products, engaged customers, and top regions, empowering data-driven decision-making.